Applied ML for Cybersecurity | Part 3: Exploring macOS Unified Logs
At the end of Part 2, I had completed a Bayesian statistical analysis of our system logs. Unfortunately, the logs I had were limited both in volume and in behavioural variation. This realisation led me to use a different log source. This represented an important step forward for the project, as a production security pipeline would rarely rely on a single log source. I decided to bring in the unified logs (as can be interpreted from this blogs title).
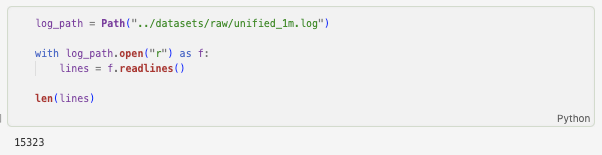
This image shows the import of a 1-minute unified log stream with 15,323 individual logs. A far larger dataset for me to work on.
From here, I completed much of the same process that can be observed in Part 1 of this blog while adapting it to handle Apple's Unified Log format. I parsed the logs using a regex pattern matching code block.
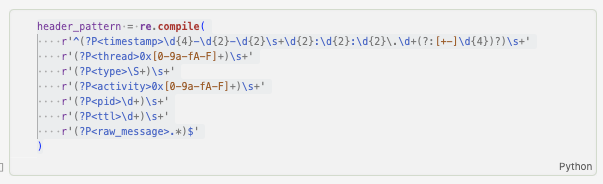
These logs contained a different schema to the original system.log dataset, requiring a new parser and database table.
Below is an example of the output:
| timestamp | thread | type | activity | pid | ttl | raw_message | process | subsystem | tags | message | |
|---|---|---|---|---|---|---|---|---|---|---|---|
| 12794 | 2026-06-22 20:01:19.394319+0100 | 0x17b5ba6 | Activity | 0x226ac0c | 392 | 0 | locationd: CL: _CLDaemonGetAppsUsingLocation | locationd | [] | [] | CL: _CLDaemonGetAppsUsingLocation |
| 12795 | 2026-06-22 20:01:19.466872+0100 | 0x17b60bb | Activity | 0x226ac82 | 88596 | 0 | iTerm2: (CoreSpotlight) end-index-batch | iTerm2 | [CoreSpotlight] | [] | end-index-batch |
| 12796 | 2026-06-22 20:01:19.468472+0100 | 0x17b60bb | Activity | 0x226ac83 | 88596 | 0 | iTerm2: (CoreSpotlight) index-items | iTerm2 | [CoreSpotlight] | [] | index-items |
| 12797 | 2026-06-22 20:01:19.676755+0100 | 0x17b0d82 | Error | 0x0 | 0 | 0 | kernel: (Sandbox) Sandbox: logd_helper(6702) d... | kernel | [Sandbox, 6702, 1] | [] | Sandbox: logd_helper deny file-read-data /Appl... |
| 12798 | 2026-06-22 20:01:19.677093+0100 | 0x17b0d82 | Error | 0x0 | 0 | 0 | kernel: (Sandbox) Sandbox: logd_helper(6702) d... | kernel | [Sandbox, 6702, 1] | [] | Sandbox: logd_helper deny file-read-data /User... |
| timestamp | thread | type | activity | pid | ttl | raw_message | process | subsystem | tags | message | |
|---|---|---|---|---|---|---|---|---|---|---|---|
| 0 | 2026-06-22 19:00:19.727566+00:00 | 0x17b458a | Default | 0x0 | 418 | 0 | WindowServer: (HSTouchHIDService) [com.apple.M... | WindowServer | [HSTouchHIDService] | [com.apple.Multitouch:Plugin, TP] | Dispatching digitizer event with 2 children, _... |
| 1 | 2026-06-22 19:00:19.862505+00:00 | 0x17b5b03 | Default | 0x0 | 357 | 8 | powerd: [com.apple.powerd:displayState] Deskto... | powerd | [] | [com.apple.powerd:displayState] | DesktopMode check on Battery 0 |
| 2 | 2026-06-22 19:00:19.862875+00:00 | 0x17b5b03 | Default | 0x0 | 357 | 8 | powerd: [com.apple.powerd:displayState] Deskto... | powerd | [] | [com.apple.powerd:displayState] | DesktopMode check on Battery 0 |
| 3 | 2026-06-22 19:00:20.006890+00:00 | 0x17b0b92 | Default | 0x0 | 0 | 0 | kernel: (com.apple.DriverKit-AppleBCMWLAN.dext... | kernel | [com.apple.DriverKit-AppleBCMWLAN.dext, ] | [] | IO80211PeerMonitor::checkForDPS Enter |
| 4 | 2026-06-22 19:00:20.007193+00:00 | 0x17b0b92 | Default | 0x0 | 0 | 0 | kernel: (com.apple.DriverKit-AppleBCMWLAN.dext... | kernel | [com.apple.DriverKit-AppleBCMWLAN.dext] | [] | LQM-WiFi: BE : Count: 45 avgLatencyMs:2 maxLat... |
Then I normalised the unified log timestamps to UTC so downstream statistics and ML notebooks can compare events on a consistent timeline. Maintaining a consistent timeline is paramount in a security setting, as it enables incident reconstruction and accurate correlation of events across multiple data sources.
Following some data enrichment, the dataset contained several additional engineered features. Engineered and Parsed Features include:
| Category | Features |
| Core Fields | timestamp, thread, type, activity, pid, ttl, raw_message, process, subsystem, tags, message |
| Time-Based | hour, day_of_week, is_weekend, off_hours |
| Behavioral | process_frequency, subsystem_frequency, is_system_process, rare_process, first_seen_time, first_seen, session_id, first_seen_session, count_last_hour |
| Security & Text | is_error, is_fault, security_related, message_length |
These engineered features also enabled a range of exploratory visualisations:
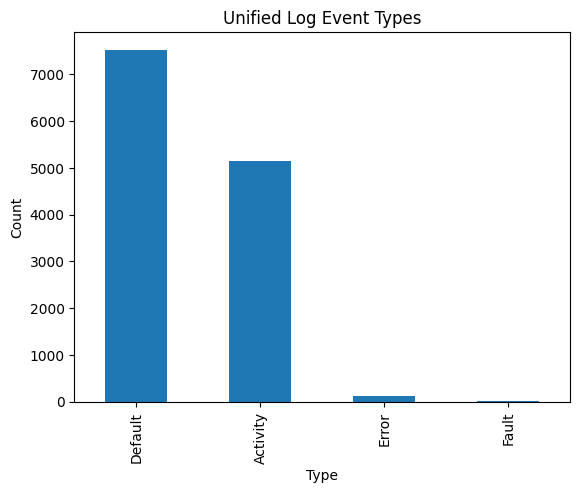
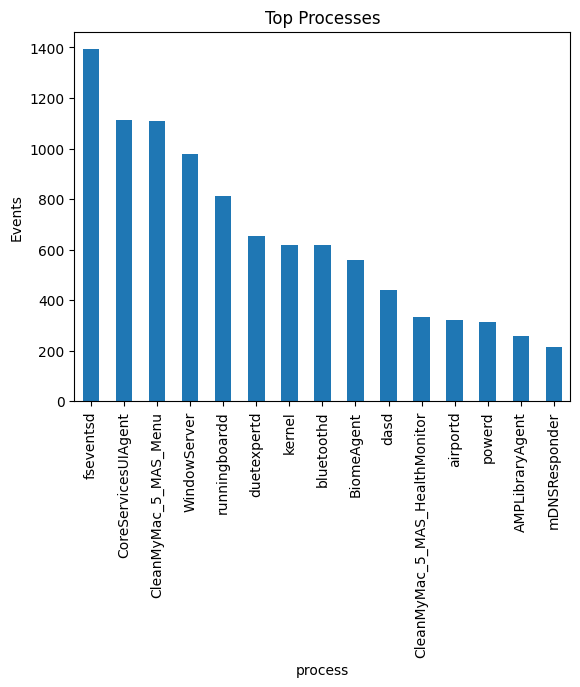
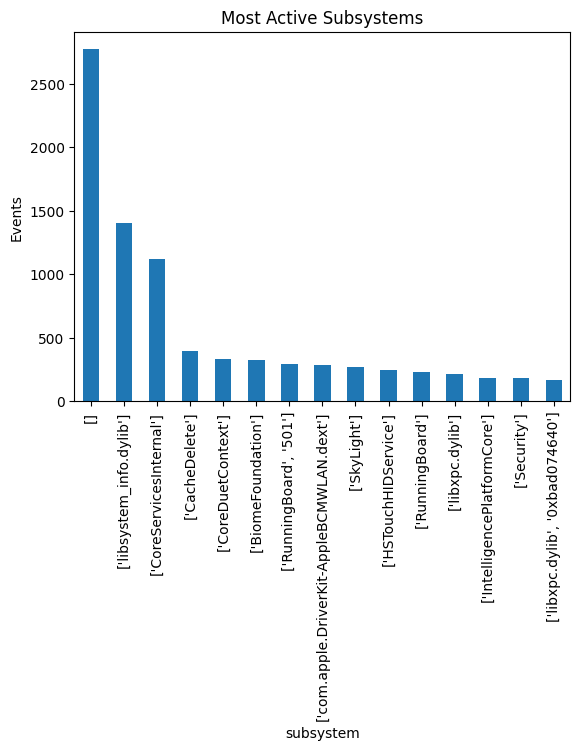
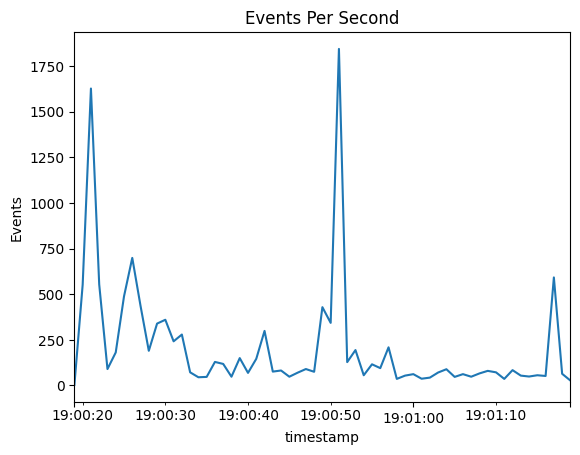
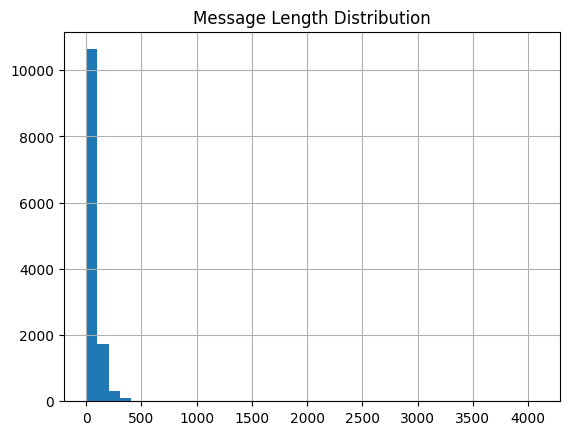
Above we have graphs and charts for Unified Log Event Types, Top Processes, Most Active Subsystems, Events Per Second and Message Length Distribution.
Each visualisation contributes to a better understanding of the dataset:
Unified Log Event Types
The first visualisation breaks events down by log type (Default, Activity, Error and Fault). This provides an immediate overview of system health. In most environments, Default and Activity events dominate normal operation, while Error and Fault events deserve greater attention because they often indicate failed operations, driver issues or application problems. Although not every error represents malicious activity, they provide useful starting points for investigation.
Top Processes
Examining the most active processes helps establish a behavioural baseline of the operating system. Unlike the earlier system.log dataset, where almost every event originated from syslogd, the unified logs capture activity from many different processes including WindowServer, kernel, powerd, locationd and iTerm2. This richer diversity makes later anomaly detection significantly more meaningful, as unusual or previously unseen processes can now be identified.
Most Active Subsystems
macOS records activity from many internal subsystems, each responsible for different components of the operating system. Visualising subsystem frequency highlights which areas of the OS are most active during the capture period. This information becomes valuable later when looking for unusual spikes within normally quiet subsystems or identifying components that suddenly begin generating large numbers of events.
Events Per Second
Plotting events per second illustrates the overall rate of logging throughout the one-minute capture. Rather than looking at individual events in isolation, this graph reveals periods of increased activity that may correspond to user interaction, background tasks or system operations. Burst analysis such as this often forms the basis of statistical anomaly detection techniques.
Message Length Distribution
Finally, message length provides another simple behavioural feature. Most routine operating system messages are relatively short and consistent in size, while unusually long messages may indicate stack traces, verbose debugging output or complex error reports. Although message length alone is not sufficient for anomaly detection, it becomes a useful feature when combined with others within a machine learning pipeline.
This project has now surpassed simple log parsing/normalisation and enters the realm of constructing a richer dataset. The unified logs expose thousands of events across numerous processes and operating system subsystems. This will enabled us to have much stronger analytics and machine learning going forward.